SoftBank Smart City Unified Platform
- DX Strategy
- Mar 31, 2023
- 3 min read
Updated: Mar 28
Timeline: 2023.02-2023.04
Client: SoftBank Corp.
Role: Creative Director, Art Direction, UIUX Designer
Executive Summary
Objective: Selling the Invisible
SoftBank possessed vast urban data but struggled to sell it because clients couldn't visualize its value. My mandate was to build a Digital Twin Platform that transforms raw numbers into a convincing visual story.
The "Black Box" Problem
We identified three critical friction points in the Smart City business:
Hard to Sell (SoftBank Consultants): Lacked visual tools to explain abstract concepts, leading to lost deals.
Hard to Clear (Junior Area Managers): Struggled to get police approval for events due to vague verbal explanations.
Hard to Prove (Senior Area Managers): Couldn't show "Before vs. Actual" ROI data to justify budgets to executives.
Solution: A Dual-Purpose Engine
A unified 3D Dashboard that serves two realities simultaneously. It functions as a Simulation Tool for area managers (to solve operational problems) while acting as a Sales Weapon for SoftBank consultants (to demonstrate value).
Official Press Release: SoftBank Smart City Initiative (May 2025)
Research & Empathy
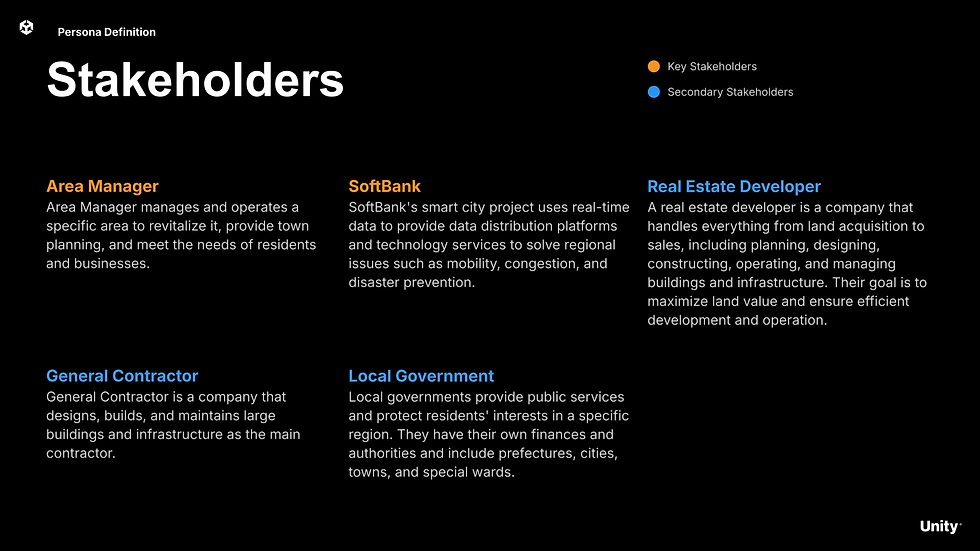
To design the "Dual-Purpose" experience, we defined three distinct personas split into two groups: the Hypothetical Users (inside the scenario) and the Actual User (holding the device).
Group A: The Scenario Characters (Hypothetical Users) Targeting Operational Success
1. The Orchestrator (Junior Area Manager)
Role: On-site execution.
Pain Point: Overwhelmed by logistics and safety risks. Needs Simulation & Real-time Monitoring.
2. The Strategist (Senior Area Manager)
Role: Budget & Policy.
Pain Point: Lacks quantitative evidence. Needs ROI Verification to prove the project's success to the C-suite.
Group B: The Demo Operator (Actual User) Targeting Sales Success
3. The Seller (SoftBank Consultant)
Role: B2B Sales.
Pain Point: Struggles to communicate value. Needs a Visual Storytelling Tool to customize demos and close contracts.


Ideation
Point of View (POV)
We hypothesized that the best way to sell a Smart City solution is to "Let the client see the future." The UI must be robust enough to solve the Area Managers' (Junior/Senior) problems, yet flexible enough for the Consultant to present smoothly.
Solution: The Dual-Track Scenarios
We structured the solution into two parallel tracks: one showing "What the product does" (for Area Manager), and one showing "How to sell it" (for SoftBank Consultants).


Prototype
We moved away from the previous model of developing separate demos for each case. Instead, we designed a Unified UI Application that integrates diverse data sources into a single, cohesive experience.
1. Synergizing Physicality with Proprietary Insights (The Data Moat)
Feature: BIM Integration & Proprietary Big Data Synthesis.
Design Logic: The platform’s core differentiator lies in its synergy of high-fidelity BIM and Open Data with SoftBank’s exclusive proprietary data assets. By anchoring real-time mobility and demographic insights within a realistic 3D baseline, we transform abstract metrics into actionable business intelligence visualized in its true spatial context.
2. Evidence-Based Decision Support (The Strategic Tool)
Feature: Historical Playback & Contextual Metrics.
Design Logic: Built to facilitate Evidence-Based Policy Making (EBPM), this interface enables Area Managers to perform temporal analysis through a synchronized timeline. By scrubbing through historical data, users can benchmark past visual patterns against quantitative sidebar metrics. This allows managers to validate the impact of previous policies and generate the visual proof necessary to justify future budgets to executives.
3. Thematic Scenario Engineering (The Sales Engine)
Feature: Scenario-based Configuration UI.
Design Logic: To provide SoftBank consultants with storytelling agility, we designed a modular control panel for configuring Thematic Scenarios. By instantly merging distinct visual layers—such as overlaying Hazard Maps with SoftBank Mobility Data to create a "Disaster Prevention Scenario"—the sales team can pivot their narrative on the fly to meet specific client needs without requiring additional engineering support.


Solution Roadmap
Our roadmap is not just a delivery schedule; it is a strategic plan to evolve the platform from a "Visualization Tool" into an "Automated Proposal Engine."
We structured the development into three Milestones to balance immediate user value with long-term in-house capabilities. The goal is to move from basic "Big Data Visualization" (Milestone 1) to "Trend Analysis" (Milestone 2), and finally to a fully "In-House Production System" (Milestone 3 & Goal). This evolution is designed to secure a 90% win rate in the Smart City market.


Reflection

From "Invisible" to "Indispensable"
We didn't just design a dashboard; we solved the "Black Box" problem. By transforming abstract BIM data into a visual sales weapon, we bridged the critical gap between complex technology and client understanding.
Scalability through Unification
Moving from a fragmented, case-by-case workflow to a Unified Platform was a strategic pivot. This shift didn't just improve consistency—it empowered internal teams to produce proposals independently, drastically reducing engineering overhead and accelerating the sales cycle.
Redefining the Standard
Ultimately, this project evolved from a visualization tool into a decision-making engine. By anchoring the experience in Evidence-Based Policy Making (EBPM), we shifted the conversation from "buying data" to "investing in urban success," setting a new benchmark for Japan’s Smart City infrastructure.
Comments